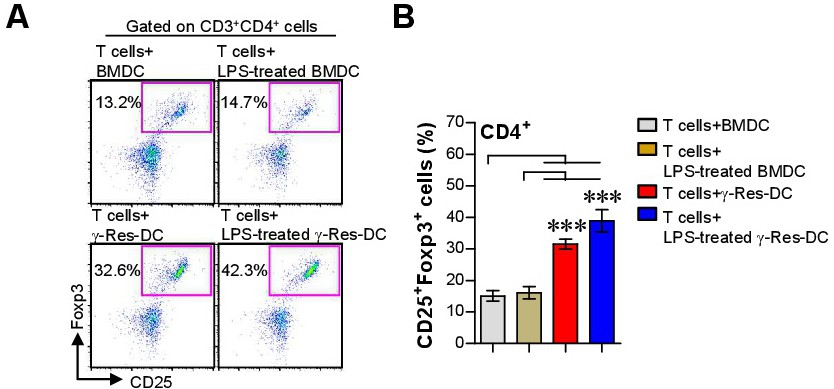
Fig. 10. Induction of regulatory T cells by DCs generated by γ-Res. A, B) CD4+ T cells were isolated as described in the Methods section. BMDCs and γ-Res-DCs were co-cultured with isolated CD4+ T cells for 3 days and stained with anti-CD25 and anti-Foxp3Abs. The CD25+Foxp3+CD4+ T cells were analyzed by flow cytometry. B) The bar graph shows the percentage of CD25+Foxp3+ regulatory T cells among the CD4+ T cells. All results are representative of three independent experiments. The values shown represent the mean ± SD (n = 3 samples per group). ***p<0.001.